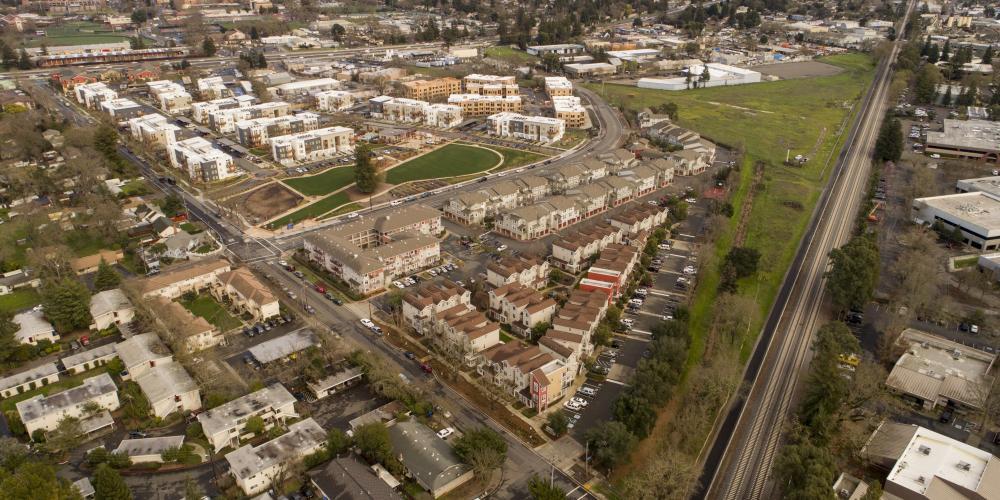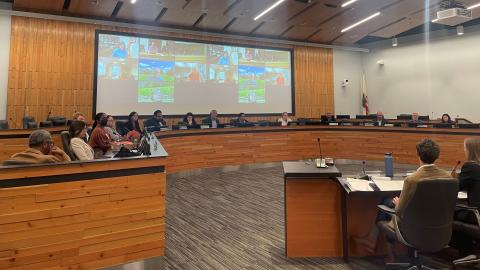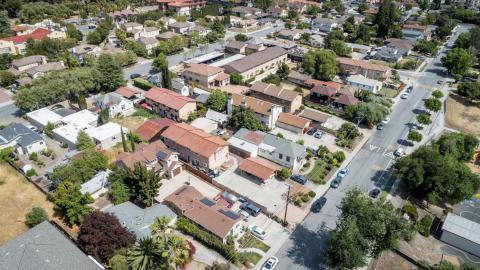
The latest dispatch from America Counts: Stories Behind the Numbers from the U.S. Census provides an in-depth look at how data informs advocacy on both sides of the Bay Area’s housing debate. The story, NIMBY Meets YIMBY: Housing Movement Pushes for More Housing, shows how Census data is used to analyze everything from jobs to housing balance, rent burdens, building permit data and demographic change.
From the article:
Recently, the quest for housing affordability has dominated the national conversation. According to the 2016 American Community Survey (ACS) 1-Year estimates, 38.2 percent of rental households in the San Francisco Metro Area were spending at least 35 percent of their income on basic housing costs and 27.8 percent of homeowners with a mortgage were in the same situation.
In the nearby San Jose Metro Area, 37.2 percent of renters and 26 percent of homeowners spent at least 35 percent of their income for housing needs. East Bay for Everyone is one of several YIMBY organizations that have popped up in the San Francisco Bay Area and other cities. They are showing up at county and city planning meetings demanding that policy makers find solutions to the region’s housing crisis. They are pushing for more flexible zoning and more affordable high-density development….
The 2016 ACS 1-year estimates show Bay Area housing as among the most costly in the nation. The median value of a single-family home in the San Francisco Metro Area is $796,100 and $911,900 in the San Jose Metro Area, with median mortgages at $2,842 and $3,072. Median rents are $1,757 and $2,044, respectively.
The 2016 ACS Median Household Income in the San Francisco Metro Area is estimated at $96,667 and in the San Jose Metro Area, it’s $110,040. YIMBYs say salaries have not kept up with the pace of the region’s galloping housing costs.
Read the whole thing. For a look at how individual counties compare with their overall state along a number of key characteristics, as well as the country as a whole, check out the below chart from the Census which provides 5-year Estimates from the 2016 American Community Survey. You can see how your own county stacks up in terms of population, average household size, education, commutes, home values, incomes, and much more.


Submit your comment
In order to receive a reply to your comment, please provide an email address.