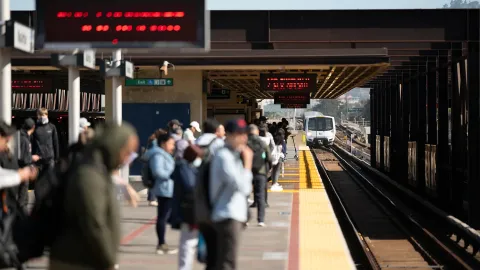
MTC’s monthly transportation statistics are regularly updated with figures that paint a comprehensive picture of transportation usage in the Bay Area.
With reports on crossings for all seven of the Bay Area’s state-owned bridges, as well as weekday BART trips and newly-added Clipper® card data, MTC website visitors can see and analyze mobility trends across different transportation modes.
For example, one-way crossings for the San Francisco-Oakland Bay Bridge have been generally on the rise since the COVID-19 shelter-in-place orders in March 2020. While there have been a few small dips in the number of crossings, the figures largely have held at upwards of 3.5 million crossings per day (around 92% of pre-pandemic traffic) since March 2021.
Similarly, the figures for the other six state-owned bridges (the Antioch, Benicia-Martinez, Carquinez, Dumbarton, Richmond-San Rafael and San Mateo-Hayward bridges) have been totaling over 5.5 million crossings per day on average (75% of pre-pandemic levels) since January 2021.
The figures on the monthly transportation statistics web page typically are updated early in the month, when data become available.


Submit your comment
In order to receive a reply to your comment, please provide an email address.