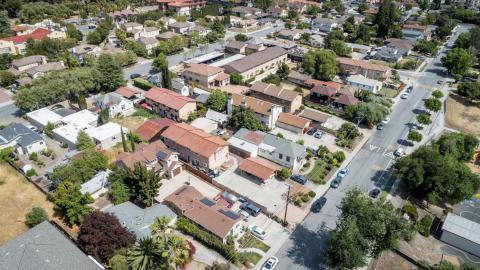
On the Bay Area housing beat there’s good news and bad news.
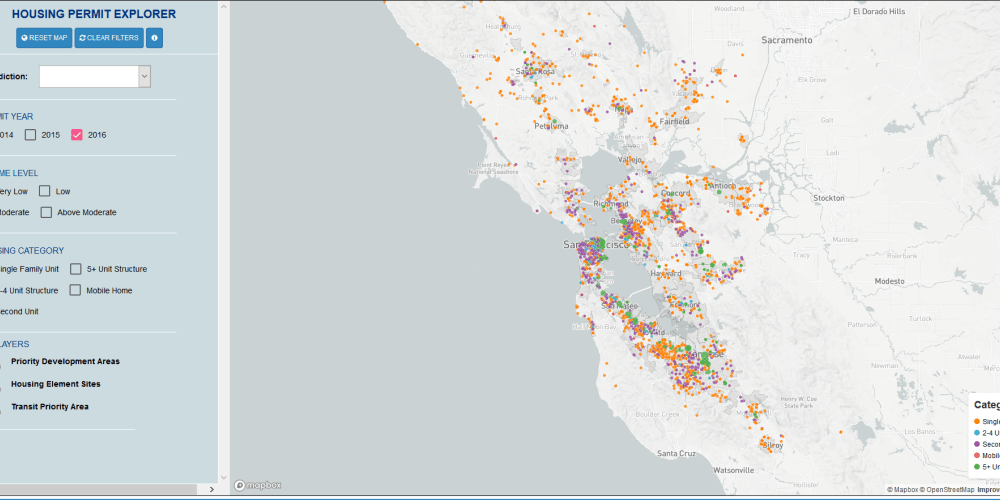
The good news is that at yesterday’s ABAG Regional Planning Committee meeting, staff unveiled an exciting new online housing data portal. The portal provides easy access to data related to housing permit activity as well as local adoption of housing policies in the 101 towns and cities and nine counties of the San Francisco Bay Area.
The permitting data will allow users to see the affordability level (very low, low, moderate, or above moderate income), housing type (single family, multifamily, mobile home, second unit) and location of every single unit permitted in the region from 2014-16. The policy data will let users see the housing policies and programs that jurisdictions across the region are using to increase housing supply and affordability, preserve existing housing choices, and protect residents from displacement. Read more on ABAG’s website or check out the portal for yourself.
The bad news is, well, what the data actually says. Below are key findings from an analysis of the 2016 permit data in a memo presented by staff to the committee:
- The Bay Area did not issue enough permits to meet the region’s housing needs. Jurisdictions issued permits for 21,320 new units. This falls short of the 23,499 units per year needed to meet the region’s eight-year need as determined by the California Department of Housing and Community Development (HCD) and was significantly below the annual level (27,433) encompassed in the Plan Bay Area 2040 forecast. Each year of insufficient production exacerbates the need for higher levels of production in future years.
- The shortfall was particularly acute for very low-, low- and moderate-income households. 82% of units were for above moderate-income households (120% or more above the area median income), nearly double the share of the region’s total need for this income group (42%) according to HCD’s determination.
- The share of growth in PDAs falls short of Plan Bay Area 2040 goals. 60% of units are in PDAs — far short of Plan Bay Area’s goal for 77% of new households to be in PDAs. To meet the Plan’s goals, the region will have to not only increase the total amount of housing built in the future, but specifically the amount built in PDAs.
- Most new homes are not on opportunity sites identified in local Housing Elements. In 2016, 24% of the housing units for which permits were issued in the Bay Area were on parcels jurisdictions identified in their 2015-2023 housing site inventories. Although we know the location of the units for which permits were issued, we do not have a region-wide inventory of local zoning that would enable analysis of the types of sites where new homes are being sited.
For a deeper dive on the portal, permit data and policy data, see the below documents.
Key Documents
Memo: Analysis of 2016 Permits and Local Policies and Launch of New Housing Data Portal
PowerPoint Presentation: Analysis of 2016 Permits and Local Policies and Launch of New Housing Data Portal
Attachment 1: Analysis of Bay Area 2016 Housing Permitting Activity
Attachment 2: Analysis of Bay Area Housing Policies and Programs
For questions or more information, contact Gillian Adams, Housing Program Manager, at gadams@bayareametro.gov.


Submit your comment
In order to receive a reply to your comment, please provide an email address.