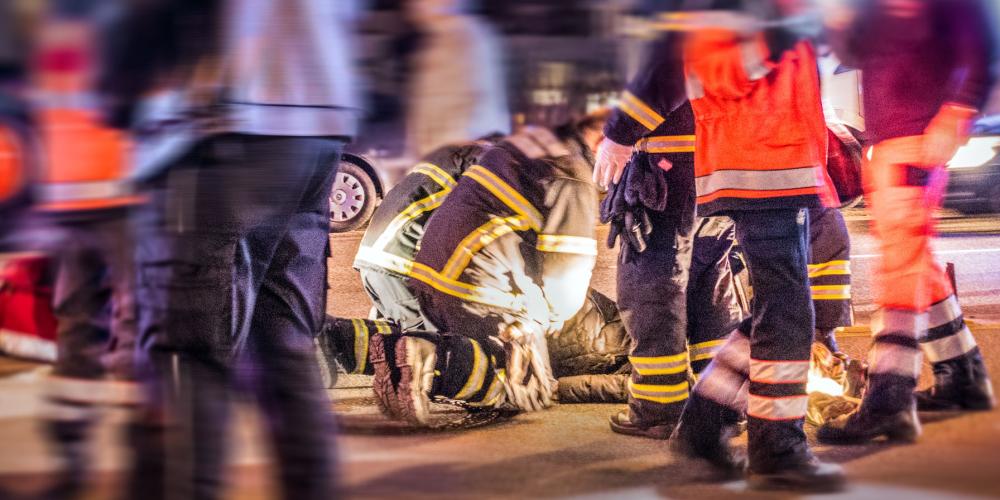
Bad news for the Bay Area’s pedestrians, bicyclists and drivers: the latest data from Vital Signs, the Bay Area’s comprehensive performance monitoring website, shows a sharp upward trend in road fatalities and injuries from roadway crashes.
There were 455 fatalities and 2,089 injuries from crashes in 2016, representing 43 percent and 25 percent increases from 2010, respectively. Although roads have become increasingly safe for motorists thanks to improved vehicle safety technologies, the data show that bicyclists and pedestrians are a growing share of fatalities and injuries in the region and experienced higher fatality levels than in decades past.
Historical Trend for Fatalities from Crashes
As the region’s economy has boomed, the number of fatalities and injuries has grown faster than both vehicle miles traveled and population growth. Although over 90 percent of these crashes result in only minor injuries, hundreds of people are tragically losing their lives every year on our region’s highways, arterials and local streets.
Historical Trend for Injuries from Crashes
Thankfully, 2017 brought at least some better news. As reported in the Chronicle, San Francisco saw a record low number of traffic fatalities last year:
San Francisco recorded the lowest number of traffic fatalities in the city’s history last year, a welcome decline that city officials largely credit to sustained investments in street-level safety measures and public awareness campaigns.
The 20 traffic-related deaths that occurred in San Francisco in 2017 mark the fewest number of people killed on city streets since 2010, when there were 24 deaths. It’s also 10 fewer deaths than the 30 that occurred in 2016 and the 31 recorded in each of the prior two years. The city first began counting fatal collisions in 1915, when there were 68 fatalities. The highest number of deaths — a staggering 158 — occurred in 1927.
Since 2014, efforts to reduce fatal traffic incidents on San Francisco’s streets have centered on the city’s Vision Zero SF program. The ambitious initiative, championed by former Mayor Ed Lee, seeks to eliminate all traffic fatalities by 2024 through a combination of intensive data analysis, street engineering projects, public-safety campaigns and smarter police enforcement of traffic crimes.
On the other side of the country, New York City – which has its own Vision Zero program – also experienced a record low number of traffic fatalities in 2017. These data points suggest that meaningful progress in reducing traffic fatalities is possible, especially when a committed policy framework such as Vision Zero is in place.
The trick now will be in extending the gains seen in San Francisco to the entire region. To that end, it’s notable that in December MTC agreed to support a statewide goal of achieving a significant reduction in fatalities and serious injuries on all public roads and public transportation systems. This goal, termed Towards Zero Deaths for its goal of zero traffic fatalities by 2030, is just one component of a larger federal performance targets project, which requires MTC to set short-range performance targets for the nine-county Bay Area in support of national transportation goals, such as safety, infrastructure condition, congestion reduction and environmental sustainability, among others.
(Keep track of the overall initiative on MTC’s Federal Performance Targets page and watch for detailed performance monitoring data and analysis to be rolled out over the course of 2018 on Vital Signs.)
About Vital Signs
A joint project of MTC and the Association of Bay Area Governments, Vital Signs tracks the state of the region via 40 indicators covering transportation, demographics, housing, the economy, the environment and equity. This data-driven website uses interactive visualizations that allow viewers to explore historical trends, examine differences between cities and counties, and even compare the Bay Area with other peer metropolitan areas.
In the coming months, Vital Signs will release additional datasets on a rolling basis. Updates will include the latest data on transit infrastructure, housing production and commuting trends.


Submit your comment
In order to receive a reply to your comment, please provide an email address.