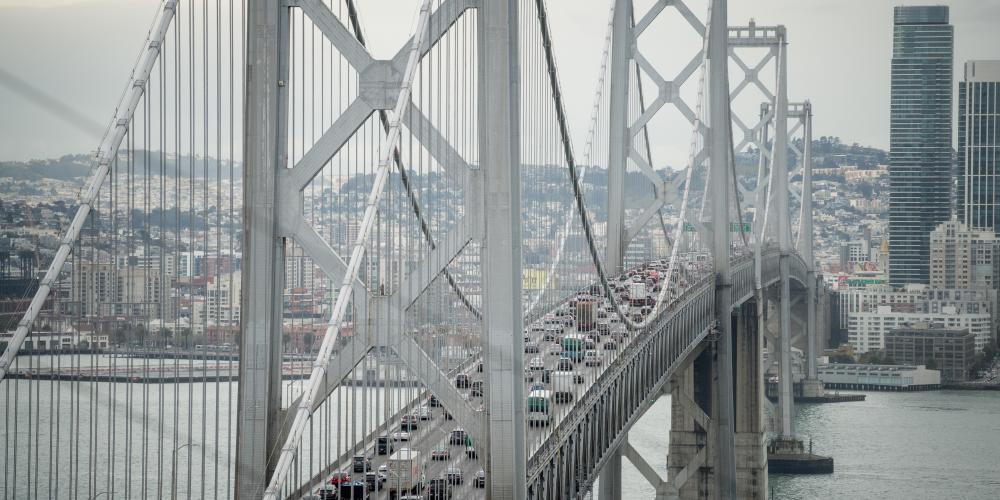
Using data from MTC, the Bay Area Council has created graphics showing the flow of regional bridge traffic since the start of the pandemic.
The graphics shows Bay Area bridge traffic from October almost matching pre-pandemic levels.
The Bay Area’s seven state-owned toll bridges were at 88% usage in October, compared to the same month in 2019. Some bridges, such as the Antioch and Carquinez, are at nearly 100%.
The graphics allow users to view bridge traffic in total, or for individual spans.
As 2022 approaches, a growing number of Bay Area companies and businesses are returning to the workplace, at least partially, the council notes.


Submit your comment
In order to receive a reply to your comment, please provide an email address.